Duc Le
Tuesday, August 22, 2023
Diagram as code
About Diagrams
Diagrams lets you draw the cloud system architecture in Python code.
Official website: https://diagrams.mingrammer.com
Github repo: mingrammer/diagrams
Installation
Python >= 3.6
# https://docs.python-guide.org/starting/install3/linux/
$ sudo apt-get install python3.8
Graphviz
# https://graphviz.gitlab.io/download/
$ sudo apt install graphviz
Diagrams
# https://diagrams.mingrammer.com/docs/getting-started/installation
$ pip install diagrams
Overview
There are 4 type of objects in Diagrams file:
Diagram is a primary object representing a diagram.
Node is a second object representing a node or system component.
Cluster allows you group (or clustering) the nodes in an isolated group.
Edge is representing an edge between Nodes.

Use the extension Diagrams Previewer in VSCode to preview your diagram while editing the code.
Tutorials
Create diagram
Generate diagrams with command:
$ python3 diagram.pyParemeters: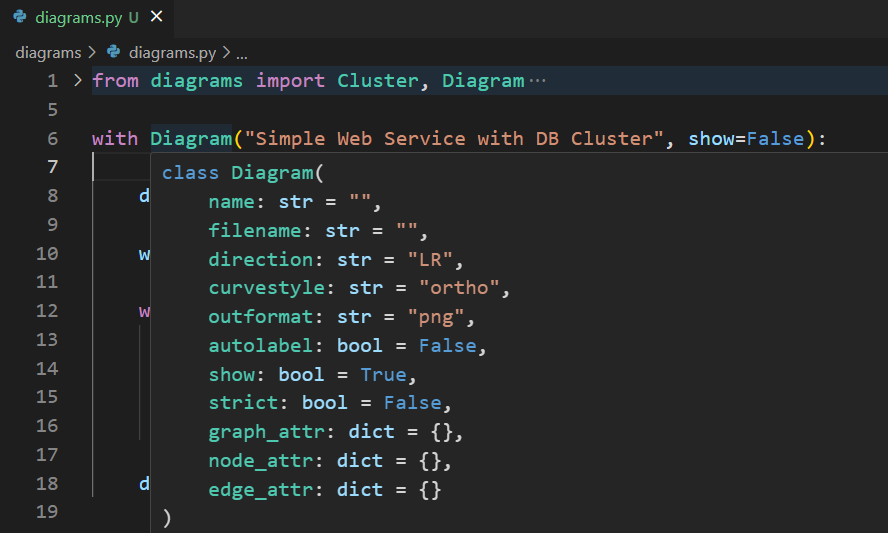
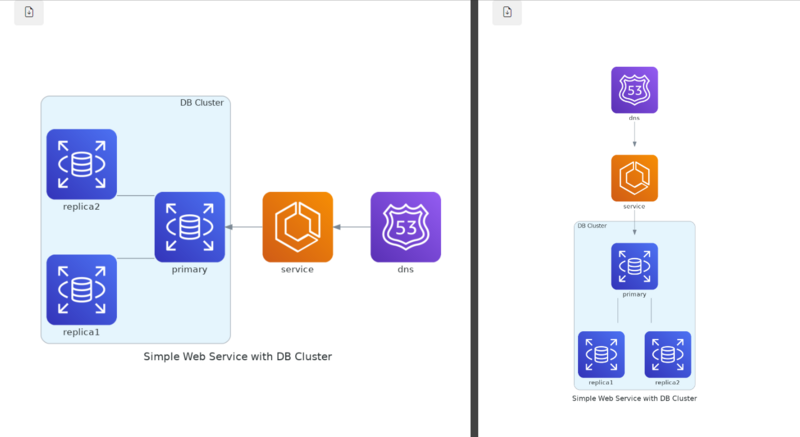
direction: Data flow direction. Default is ’left to right’. (TB, BT, LR and RL) are allowed.
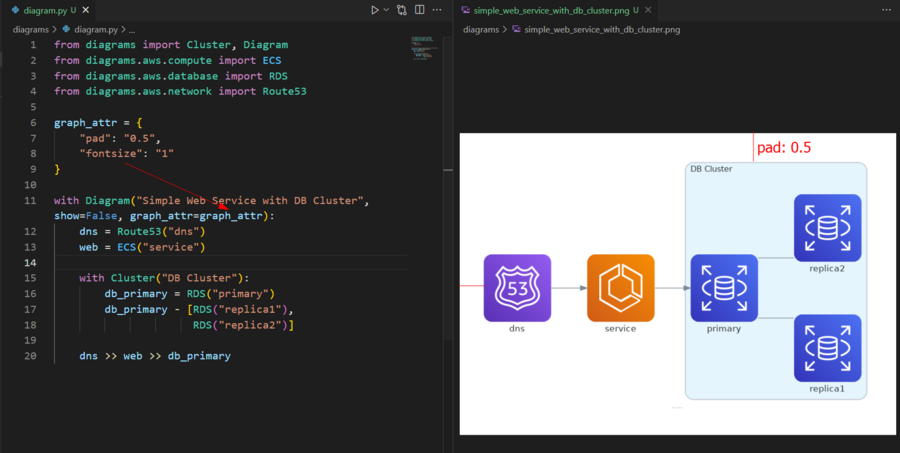
graph_attr, node_attr, edge_attr: custom Graphviz dot attributes options.
Add nodes
You can find all available nodes list in Here.
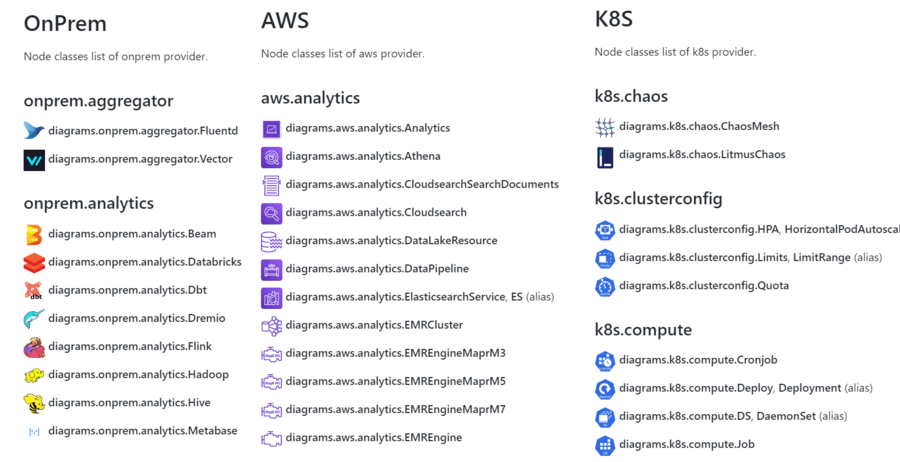
If you need an node that is not available, just create a custom node.
Group nodes to Cluster
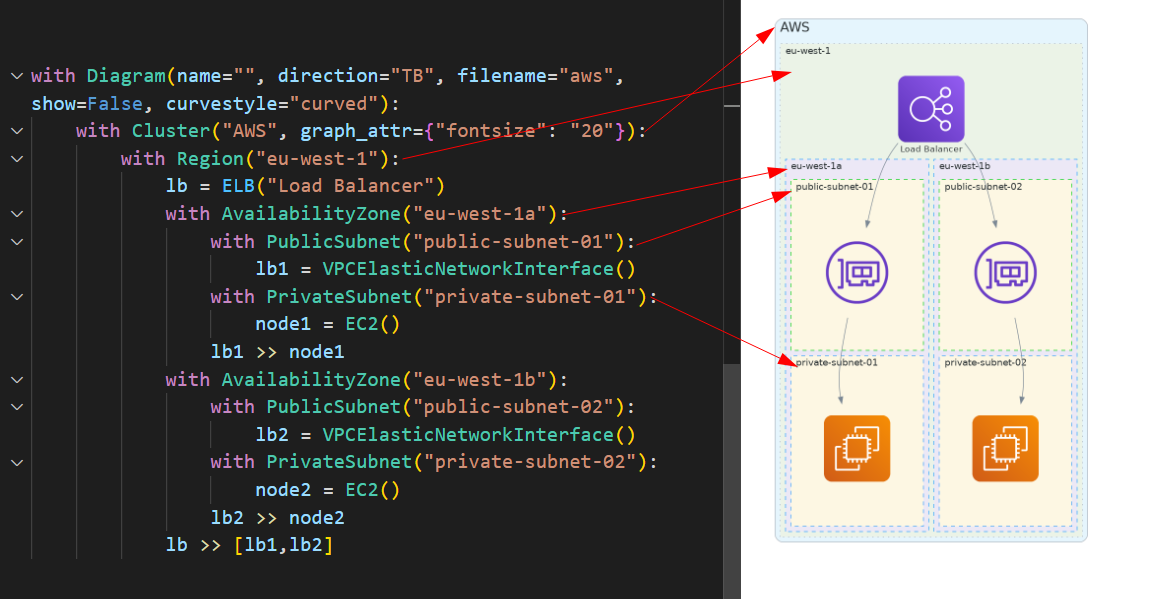
You can create a cluster context with Cluster class.
Nested clustering is also possible.
You can also custom cluster with inherited class.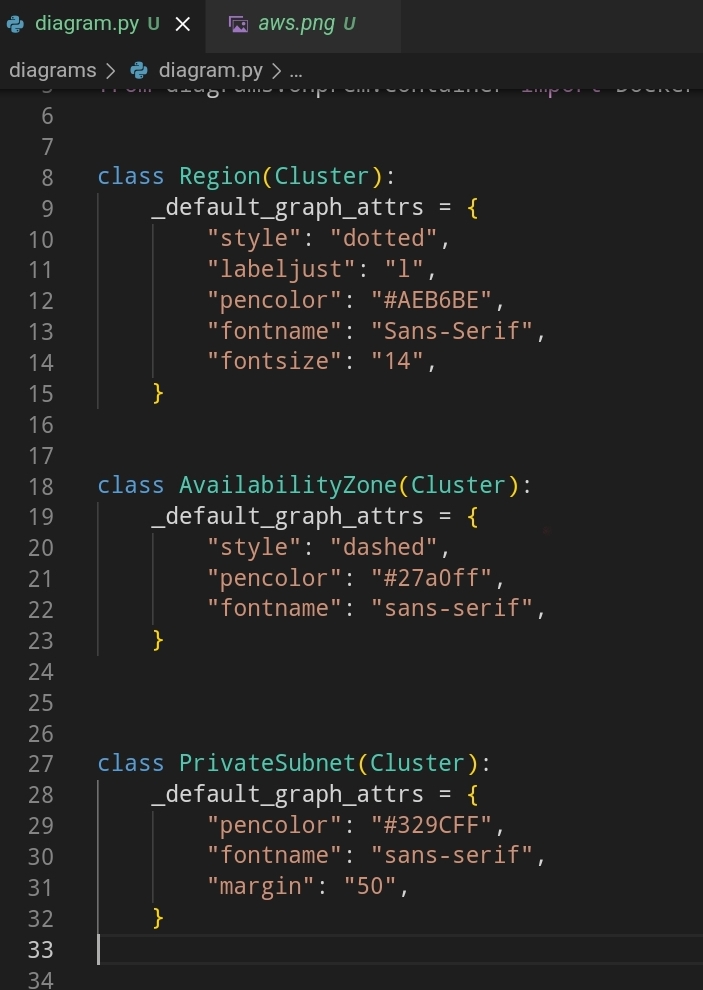
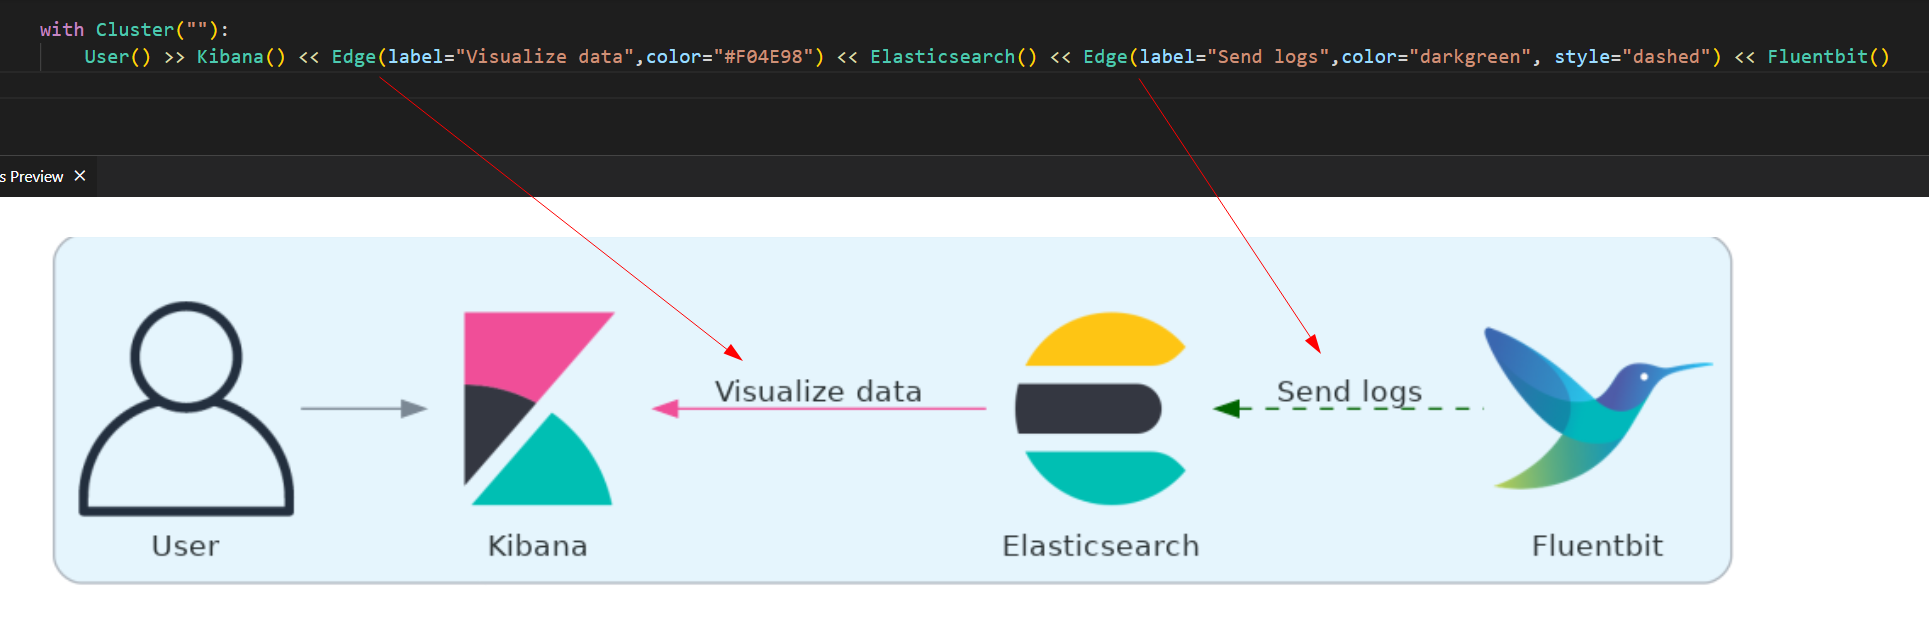
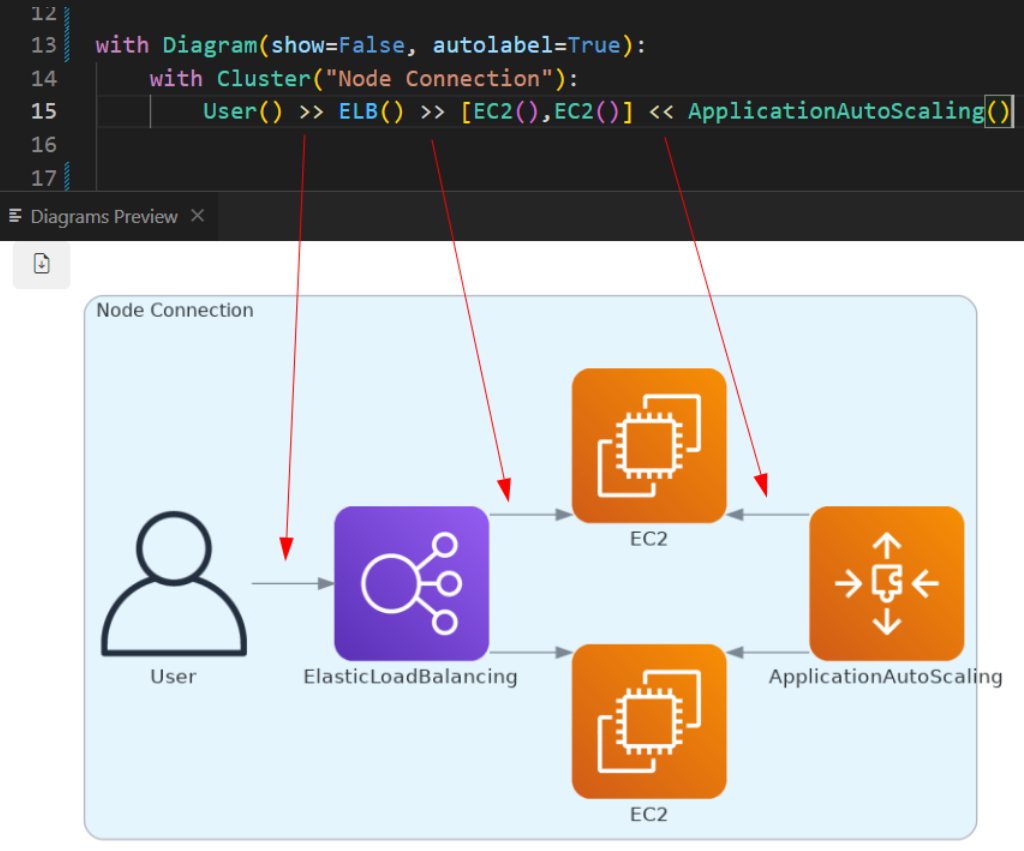
Connect nodes
You can represent data flow by connecting the nodes with these operators: », « and -
- » : Connect nodes in left to right direction.
- « : Connect nodes in right to left direction.
- - : Connect nodes in no direction. Undirected.
An edge object contains three attributes: label, color and style